Asana continues to evolve as a top-tier project management tool, and one of its latest enhancements —Grouped Bar Charts in Reporting— brings a fresh and effective way to visualize project performance.
In this guide, we’ll walk you through a practical method to compare actual vs target values in Asana, side by side, making it easier to identify trends, analyze performance gaps, and make smarter decisions.
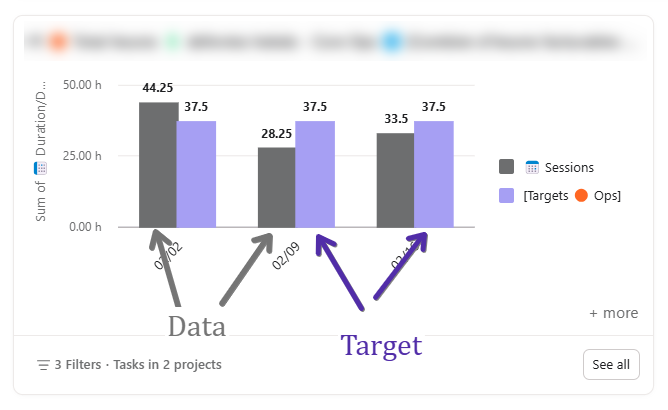
Here’s an example:
🧩 Why Use Asana Grouped Bar Charts?
When managing projects or teams, it’s common to track progress against a predefined goal or target.
Whether you’re monitoring hours worked, tasks completed, or revenue generated, comparing actual vs target values in a single report can offer valuable insight.
Asana Grouped Bar Chart visualization now makes this possible—without third-party tools.
How It Works
The approach involves setting up two projects:
- Your source of data – This contains the actual tracked data (e.g., hours worked, tasks completed, revenue generated, etc.).
- A Target Project – This contains predefined targets
Both projects share a common unit, allowing Asana to align them in the same graph. The “Group by Project” option is used in the Chart to compare the two sources of data.
Step-by-Step Setup
1️⃣ Create a Data Project
- Each task represents an entry (e.g., an hour log, a deliverable, etc.).
- Make sure the unit you track (e.g., duration, quantity) is consistent.
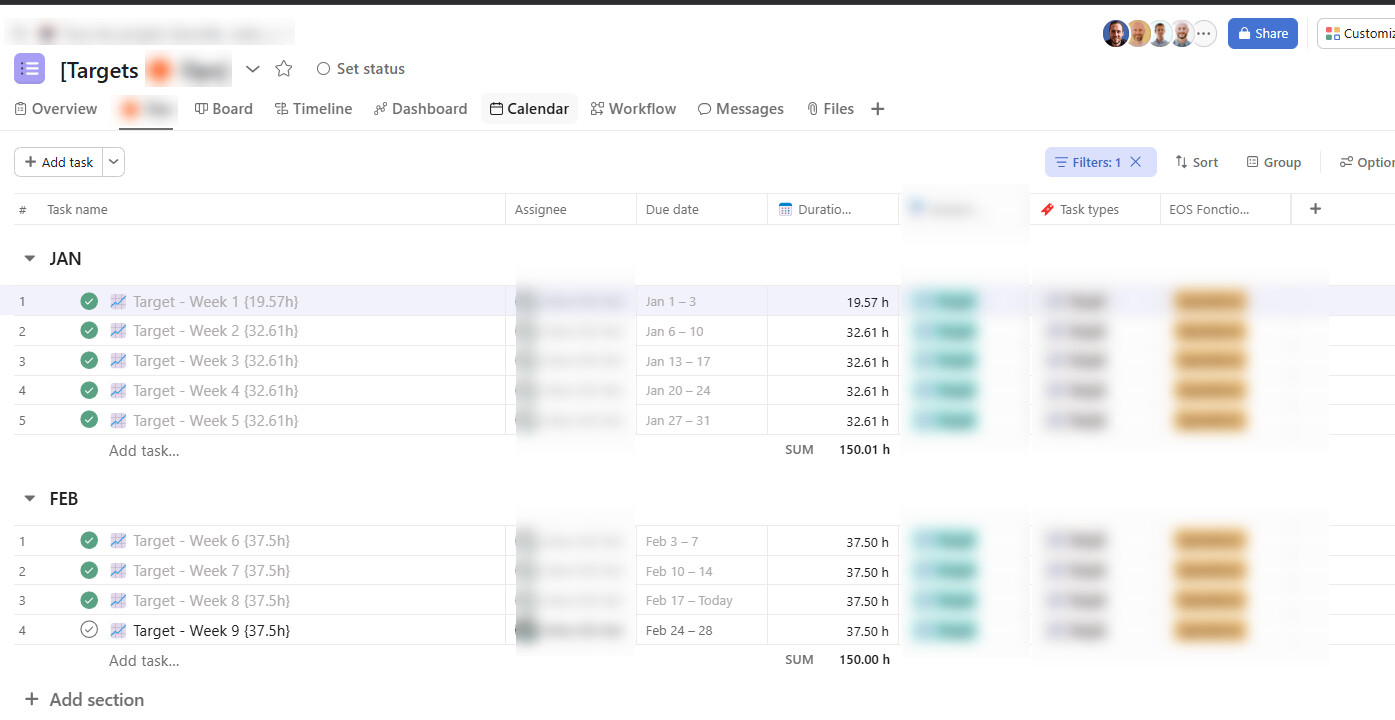
2️⃣ Create a Target Project
- This project will contain fake tasks representing the target values.
- Each task should have a time frame with start and due date (e.g., a week or a month).
- Assign the relevant target value to a numerical field
3️⃣ Ensure a Shared Unit
-
Both projects should use the same custom field to store numerical values ( this field should be added to the field library)
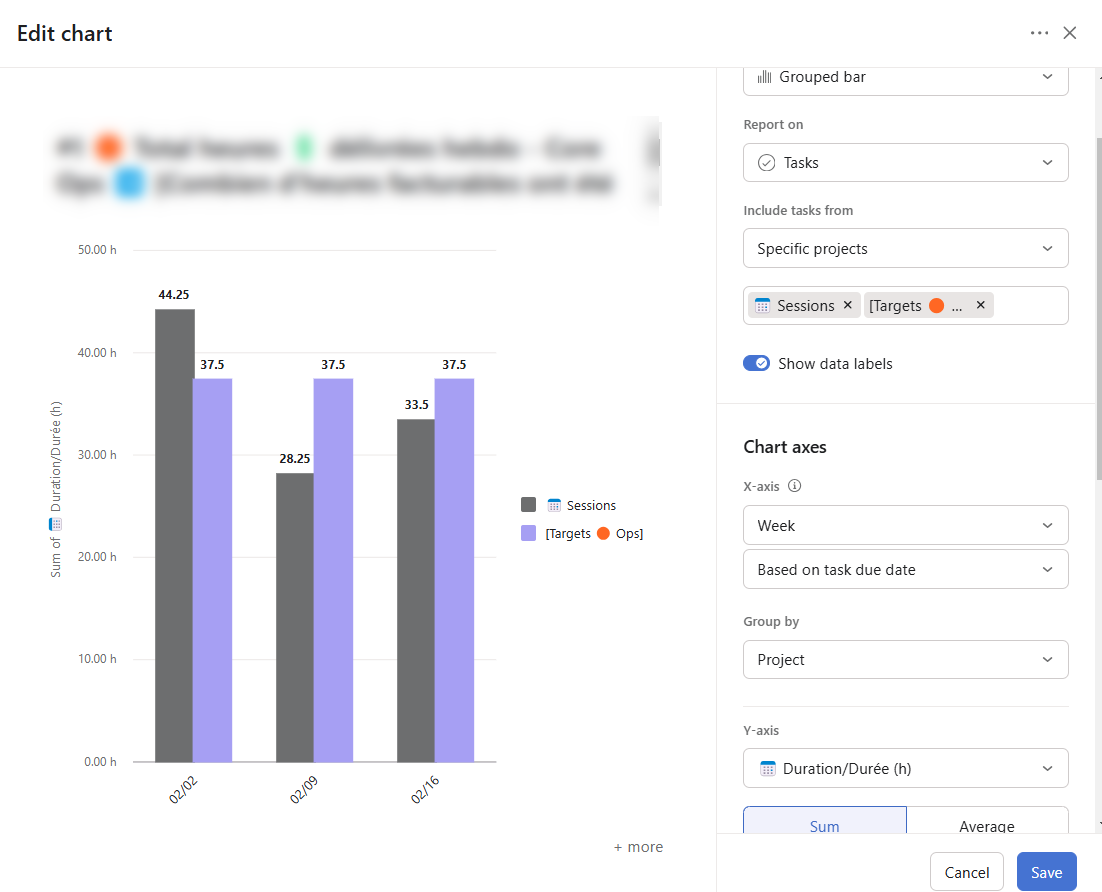
4️⃣ Set Up the Report
-
In Reporting, create a new chart, reporting on tasks
-
Select the Grouped Bar chart type
-
-
Include task from the 2 specific projects
-
X-Axis = Unit of time / Based on task due date
-
Group by Project – this will place the actual data and target values side by side.
-
Choose the common numerical field as the unit.
📈 The Result: Clear Performance Insights
You’ll get a visual report where you can easily spot underperformance or progress ahead of schedule.
These insights are incredibly useful for goal tracking, team performance reviews, and project retrospectives.
This setup may take a few extra minutes to create, but it significantly enhances your reporting capabilities inside Asana.
With Grouped Bar Charts, you can now make data-driven decisions faster, keeping your team aligned with goals.
Have questions or need help setting this up? Get in touch!